By: Emma Power
No further emission increases are tolerable. Any more half-baked measures will half-bake us.
Every year in mid-April, Canada publishes its National Inventory Report (NIR). The report outlines the greenhouse gas (GHG) sources and sinks across the country, including Manitoba. The NIR is always 2 years behind – the report published last month (2023) covers the 2021 calendar year. Given the extremely short timeline we have to bring our emissions to zero, it would be better if we could have these progress reports faster – that’s another story. In this blog, I’ll focus on what the most recent report tells us about how Manitoba is doing. First, we should go over a few basics.
GHG Emission Background
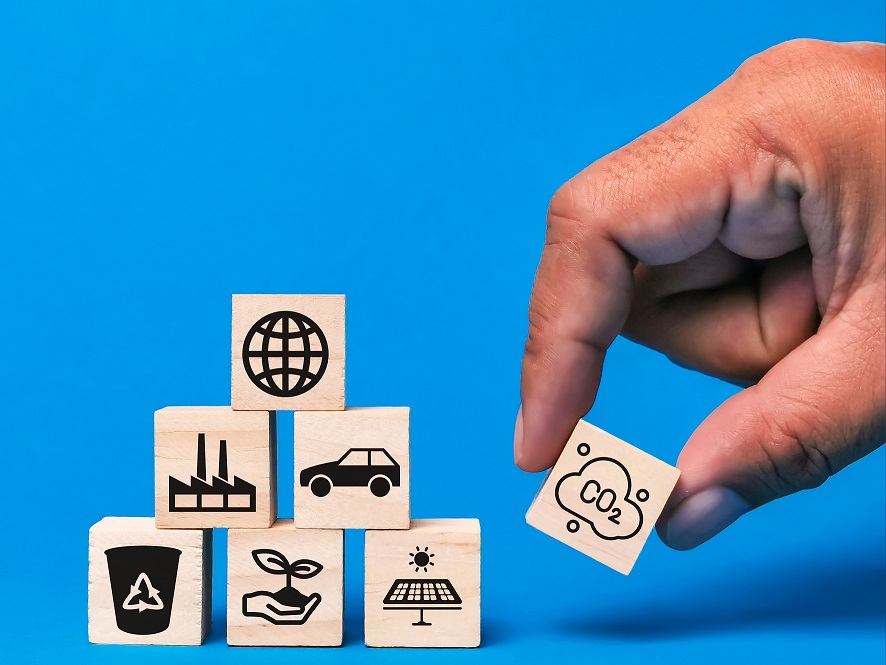
A GHG source is an action or process that results in emissions that contribute to climate change, like burning gas in our vehicles. We typically talk about GHG emissions in terms of carbon, but there are other gasses that have similar (or worse) impacts on the climate. Methane is one you’ve probably heard of. It is produced when organic waste breaks down in a landfill or in water – what cows, sheep, and goats produce in their unique digestive systems, and what results from many industrial operations such as those in the oil and gas industry. We also burn it directly in our homes – natural gas is primarily methane. Why do we always talk about methane? Because we produce a lot of it and it’s one of the worst greenhouse gases, causing 80 times more warming than carbon dioxide in its first 20 years in the atmosphere, and 28 times more warming over 100 years.
To make different sources of pollution comparable, GHG inventories like the NIR use a unit called “carbon dioxide equivalent” or CO2e, usually in tonnes (tCO2e). Think of it as measuring one thing in inches and another in centimeters but wanting to add them together.
A GHG sink stores carbon rather than releasing it. Earth has a natural carbon cycle, similar to the water cycle, and the fundamental issue that is causing climate change is that we’ve entirely messed it up. Carbon that has been safely stored underground for millions of years (from dinosaurs and other ancient organisms that broke down to become our oil and gas) has been released into the atmosphere very, very suddenly in terms of the geological timelines of the planet (we’ve done all this damage in less than 200 years). Like the oil and gas reservoirs, other types of carbon sinks only store carbon if we leave them alone or manage them properly. A living tree is a carbon sink until we cut it down, then it’s a carbon source. Healthy soils store carbon, but poor soil can release it. Quantifying carbon sinks can therefore be tricky, but it’s something that we have to figure out in order to bring Earth back into some form of balance.
Emission Reduction Targets
Overall, the point of a GHG inventory at any level – a country, a town, a company, or a household – is to measure impacts and track progress. To track progress, we need to define a baseline to compare against. Many countries including Canada have chosen the year 2005 to act as this baseline. There are reasons for this, but in reality it’s fairly arbitrary. The baseline selection changes what our reduction target percentages are (a reduction of 10 tCO2e is a 20% reduction if you’re starting at a total of 50 tCO2e, but only a 2% reduction if you’re starting at 500 tCO2e), but it doesn’t change the ultimate goal: net-zero emissions. ‘Net’ zero means that we are balancing GHG sources and sinks, the way Earth’s natural systems intended.
Canada’s emission reduction target is currently 40% below 2005 levels by 2030 and net-zero by 2050. The 2030 Emission Reduction Plan was released in 2022. Since this, the latest report from the leading scientific authority on climate change, the IPCC’s 2023 Sixth Assessment, has stated that developed nations (like us) should actually target net-zero emissions by 2040 (and a 50% reduction by 2030). We knew we didn’t have much time, but the pace of climate change is showing us up-close and personal that we have even less time to act than we thought if we are to avoid literal catastrophe (no pressure).
So, what does the 2023 National Inventory tell us about what happened in 2021? 440 Megatonnes, an initiative of the Canadian Climate Institute that tracks Canada’s progress on emissions and evaluates policy decisions, provides a succinct explanation of what went down (and up) on the national level. If you’re interested in staying up-to-date on what Canada’s budget and policy choices mean for emissions, I’d recommend subscribing to the 440 Megatonnes newsletter. They provide excellent data visualizations that help to quickly understand what’s going on.
Overall, Canada’s 2021 emissions were higher than our 2020 emissions but lower than our 2005 emissions. The impacts of COVID-19 make interpreting these numbers more difficult, but overall we know that they aren’t decreasing fast enough – not even close.
Manitoba is Lagging Behind
Manitoba’s emissions decreased between 2020 and 2021, which sounds good right? But our 2021 emissions were higher than our 2005 emissions – not good. This means that overall, we really haven’t made that much progres, nothing near the scale that we should be achieving, especially at this stage of the game (the final exam is creeping up very fast and we’ve still barely studied – if you’re not stressed, you should be).

The decline in emissions we see between 2020 and 2021 is very small (2.2%) and most likely not a result of any actual climate action. Factors beyond what we consciously decide to do or have control over have impacts on these numbers as well. Two specific factors that likely played a role in our slight emissions decrease are:
- Warmer winter – Winnipeg (where the majority of homes and buildings are) had 6% less ‘heating degree days’ in 2021 than in 2020. This likely explains why our emissions from “stationary combustion” (read: burning fossil gas for space heating) decreased by 4.5%.
- High fertilizer prices – The cost of fertilizer rose from $640 to over $700 per metric tonne between 2020 to 2021, which amounts to a 9.4% price increase. Not coincidentally, emissions from “Agricultural soils” dropped 9.65%.
We keep building more buildings, we haven’t started retrofitting existing buildings to increase their energy efficiency to any significant degree, we haven’t switched from gas to electric heating (or even stopped hooking up new buildings to gas), so really we have no reason to celebrate. If 2021 was as cold as 2020, we probably would have seen an increase in emissions, and we cannot expect any further reductions going forward unless we start taking serious, widespread action in this area.
Similarly, our agricultural practices have not significantly changed – the decrease in emissions is related almost directly to fertilizer cost, which we don’t control. Switching to lower-emission methods of farming is the only way to 1) not have to rely on synthetic fertilizers that can fluctuate dramatically in cost and availability and 2) actually reduce emissions. Without any major shifts in our methods, we can expect our emissions from agriculture to shoot right back up if fertilizer costs drop. More on this in Volume 4 of Manitoba’s Road to Resilience: Agriculture Solutions, which will be released in fall 2023.
From 2020 to 2021, Manitoba’s transportation and waste emissions increased, both of which remain higher than they were in 2005 (by 3.7% and 3.1%, respectively). This is not surprising:
- Transportation – We’re still focused on private passenger vehicles rather than public and active transportation, people still want multiple vehicles per family and prefer big trucks and SUVs to smaller cars, and we still haven’t sufficiently invested in electric vehicle (EV) infrastructure or mechanisms to make EVs more affordable. Data from MPI indicates that as of December 2022 there were over 850,000 road vehicles on Manitoba’s roads, but only 1,900 of them were fully electric – one fifth of one percent of the total. Put another way, in a province with exceptional access to low carbon electricity, only one in every 450 vehicles you see on our roads is using a locally made energy resource rather than imported fossil fuels.
- Waste – We’re still chucking most of our organic waste into landfills even though widespread composting programs could easily take care of this (plus contribute to that fertilizer problem in the agriculture sector).
What about other provinces? Are we really doing that bad?
2021 emissions were lower than 2005 emissions in every province except Manitoba and Alberta. Emission reduction has also been more challenging in the territories (Yukon and Nunavut). Some provinces have achieved relatively substantial results on a percentage basis. Compared to 2005, 2021 emissions were 43% less in New Brunswick, 36% less in Nova Scotia, and 28% less in Ontario. Each of these jurisdictions have been phasing out coal power plants which cuts emissions fairly quickly. Alberta’s emissions are increasing because of continuously expanding oil and gas operations. With how different every province and territory in Canada is in terms of weather, population, economy, and energy system, it’s hard to directly compare them to each other, but these general observations clearly show that Manitoba is moving in the wrong direction. Everyone could and should be doing better, and we really don’t have any excuses for not pulling our weight.
 (1)")
We Need to Act Now
We know exactly what we need to do in Manitoba – it’s all laid out in the Road to Resilience. There are lots of people doing lots of great work, but we need a huge investment of time, attention and financial incentives from government and industry to get on the right path.
Even if this assessment is wrong and we really did somehow reduce our emissions permanently by 2.2% from 2020 to 2021, it’s still not remotely close to what should have happened.
Climate science is telling us – screaming at us – that we have to cut our emissions in half by 2030. This is not an arbitrary number. If global emissions don’t peak by 2025 (that’s right, in TWO years), we aren’t staying below 1.5 degrees C of warming. No further increases are tolerable. Any more half-baked measures will half-bake us.
Less than 7 years to 2030. 17 to 2040. What are your plans?

Source: National Inventory Report 1990-2021
___
Emma Power is an Engineer with a background in carbon accounting. Her consulting work focuses on reducing greenhouse gas (GHG) emissions and building resilience to climate change impacts at the same time. Perspectives expressed in Emma’s writing are her own.